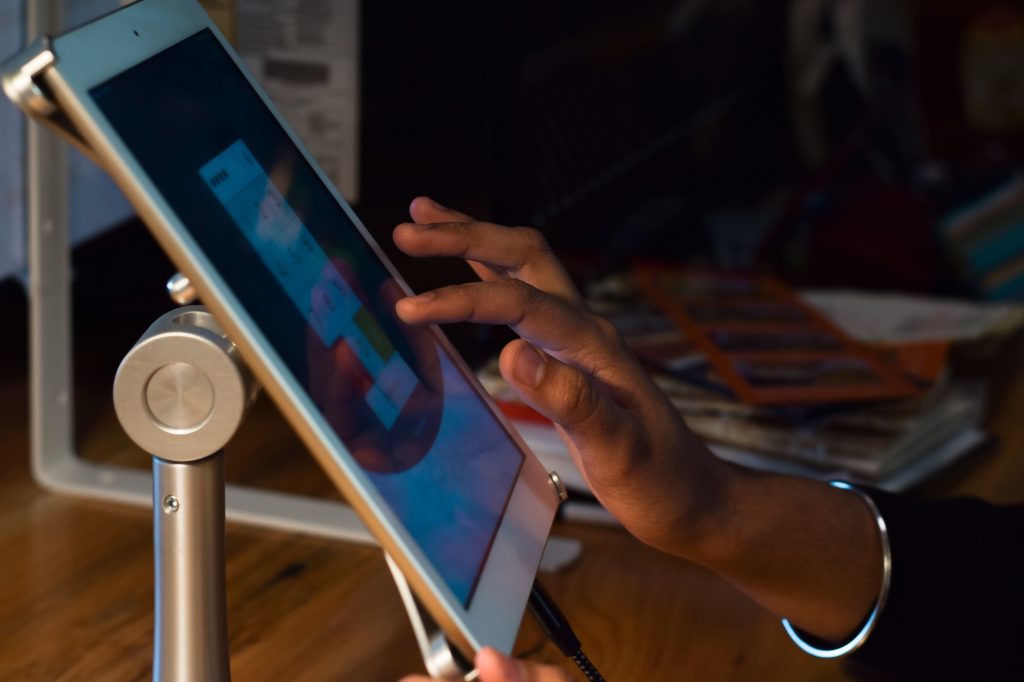
Swipe, sign, then … stare at a glowing tip screen. Those default 20 percent buttons now appear on everything from espresso bars to dog-wash kiosks, and the financial stakes have grown. Toast’s 2025 benchmark report shows counter-service tips averaging 17.4 percent, yet checkout-abandon rates spike to 9 percent when the first suggested amount jumps above 22 percent. Square’s 2025 Restaurant Operator Guide echoes the power of anchors, noting that moving the lowest preset from 15 to 18 percent raises average tips 11 percent, but also triggers more “No Tip” taps if a custom option is buried two screens deep.
Academic work confirms that interface nudges can reshape giving. A 94,000-order field experiment found that raising anchor amounts lifted tips without hurting satisfaction (Alexander, Boone, & Lynn, 2020), while newer studies show design missteps fuel tip backlash. Fan et al. (2024) demonstrated that preservice prompts drive “manipulative intent” perceptions, cutting post-purchase happiness scores by 18 percent.

Why Tip Backlash Keeps Surging
Bankrate’s June 2025 survey found 63 percent of Americans now hold at least one negative view of tipping, with 41 percent calling it “out of control” and 38 percent annoyed by pre-entered screens. The sentiment gap skews young: only 43 percent of Gen Z “always tip” at full-service restaurants, versus 61 percent of Millennials and 71 percent of Boomers.
Scholars trace this tip backlash to privacy loss and social pressure. Warren and Hanson (2025) showed that visible screens cut customers’ sense of control, depressing repatronage intent by 12 percent, even when tip amounts rise. Goh, Jungck, and Stevens (2021) replicated the pattern in a simulated coffee-shop flow: patrons felt less welcome when a staffer hovered over the POS, yet average tip size stayed flat. The emerging consensus is clear: screens can coerce dollars but corrode loyalty if not tempered by thoughtful UX.
Behavioral Science Lessons
Anchors. People rarely compute percentages under time pressure; they pick the middle button (Alexander et al., 2020). Surfacing three balanced anchors, say 15, 18, 22 percent, captures variance without provoking sticker shock. Fan et al. (2024) caution against a lowest anchor above 20 percent because consumers interpret that as “forced.”
Order effects. Lab evidence shows left-to-right sequencing nudges choice. Toast’s data reveal that flipping the order so “No Tip” appears last, not first, lifts tip acceptance 6 percent with no rise in refund requests.
Copy tone. The Cornell field study (Deng, Lu, & Cai, 2025) found that a single empathetic phrase, “Tips support our team’s living wage”, offset half of the negative emotion tied to preservice prompts. Tone works because it re-frames the ask as partnership, not coercion.
Designing Your Rapid A/B Testing Sprint
Growth teams iterate; tip screens should too. A/B testing appears five times in this article because it must appear at every stage:
- Hypothesize. Use checkout analytics to flag drop-off points and set a baseline average tip (ATV) and abandonment rate (CAR).
- Build variants. Start with two factors, anchor ladder and button order, so each variant isolates one change.
- Segment. Run cohorts by generation; Square cohort filters let you tag Gen Z mobile wallets versus Boomer chip-card users.
- Run for significance. Target a 95 percent confidence level with at least 1,000 completed transactions per cell.
- Iterate. Roll the winner, then test copy tone or tactile feedback. Keep a backlog so A/B testing remains continuous, not one-off.
Gen Z Versus Boomers
In Toast’s 2025 data, Gen Z produces the lowest ATV (15.9 percent) yet shows the biggest lift, 14 percent, when the lowest anchor drops to 12 percent. Boomers tip 19.8 percent baseline, but anchor tweaks barely move the needle; they respond more to “round-up-to-nearest-$” options. Deng et al. (2025) link this to perceived fairness norms among older diners. Designing a flexible point-of-sale UX that detects cardholder age bands lets operators personalize without fragmenting code.
From Checkout Guilt to Loyalty
| Metric | Industry Median 2025 | Target After UX Makeover |
|---|---|---|
| Average Tip % (counter-service) | 17.4 % | ≥19 % |
| Checkout-Abandon Rate | 9 % | ≤4 % |
| One-Star “Forced Tip” Reviews | 3.2 / 1,000 orders | ≤1.5 |
| Repeat-Purchase Rate (30-day) | 42 % | ≥48 % |
When Fan et al.’s manipulative-intent scale scores under 3.0 (7-point scale), repeat-purchase probability rises 9 points (Fan et al., 2024). Operators should track a proxy, negative-emotion keywords in feedback, to catch rising checkout guilt early.

Best Practices Checklist
- Calibrate Anchors: Start at 15 %. Never push lowest anchor above 18 % without testing.
- Offer a Clear “Custom” Path: One tap, same font size, no scrolling.
- Delay the Ask When Feasible: For table service, prompt post-service to cut perceived presumption (Warren & Hanson, 2025).
- Humanize the Copy: State where tips go; avoid guilt-laden language.
- Rotate Screens Away: Give guests a privacy angle from employee line-of-sight.
- Run Monthly A/B Testing Cycles: Log variants and share wins across locations.
- Monitor Tip Backlash Signals: Track “tipflation” mentions in reviews; respond within 24 hours.
The tip screen is neither hero nor villain. It is a behavioral instrument, and like any instrument it can be tuned. Anchor ladders, button order, and tone work together to lift average tips by the 12 percent operators crave, yet thoughtful privacy cues and empathetic copy quiet the rising tip backlash. Pair those insights with relentless A/B testing, and checkout guilt morphs from a PR crisis into a loyalty flywheel. In the end, the data show that customers do not mind rewarding service, they mind feeling trapped. Design for agency, and tips will follow.


